Free Suspension Tuning Spreadsheet
Suspension Spreadsheet on Google Docs
Or download: Suspension.xls or Suspension.ods (Open Office)
The Suspension Tuning Spreadsheet calculates:
Front and rear suspension frequency
Front, rear and total roll stiffness with and without bump stops
Front Roll Couple %
Wheel rates for springs and sway bars
Sway bar rates from sway bar dimensions
Spring and sway bar motion ratios
Active spring rate for dual springs
Skid pad lateral g
Dyno correction factors and corrected HP
Automotive unit conversions
Screen Capture
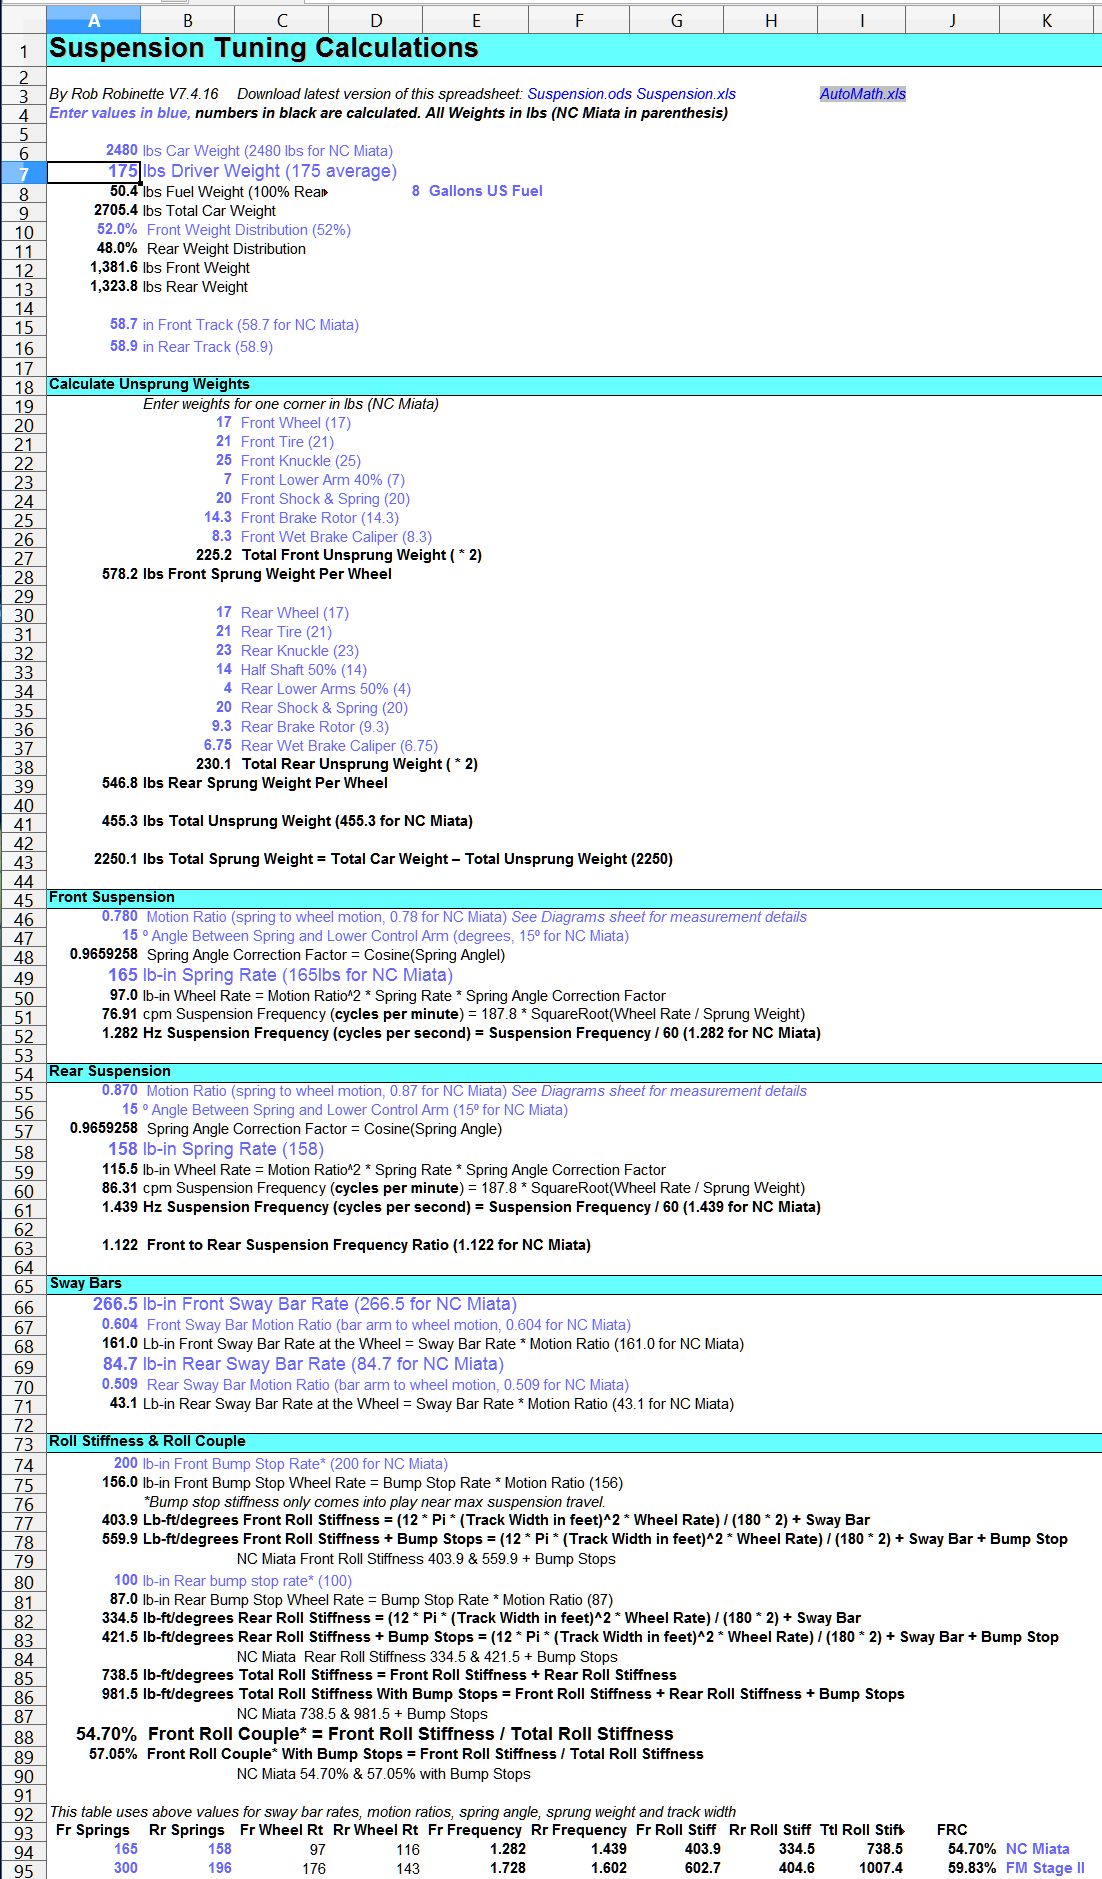
Just enter values in blue. Values in black are calculated automatically. Values in parenthesis are stock NC Miata.
Instructions
Simply enter the values in blue.
All the numbers in black are automatically calculated.The Suspension Tuning Spreadsheet allows you to analyze and design automobile spring and sway bar rates. After entering car and suspension values it calculates:
Front Roll Couple Percentage describes lateral load transfer distribution front to rear and subsequently the handling balance. It is the front roll stiffness divided by the total roll stiffness which is a ratio, front to rear, of the vehicle's total roll rate. Higher than 50% means the front wheels take more weight while cornering and the handling progresses toward understeer but for most cars around 55% gives balanced handling on the track while approximately 75% is best for autocross. For powerful cars a higher FRC% can help prevent power-on oversteer so a Honda S2000 will typically need a higher FRC% than a Miata.
Roll Stiffness Front, Rear and Total (given in pound-feet at the wheel per degree of chassis roll) describes the chassis resistance to roll during cornering. It is determined using track width and suspension and sway bar wheel rates but does not consider roll center and center of gravity.
Suspension Frequency is the natural oscillation frequency of the suspension. It is determined using only unsprung weight and wheel rate but damping and sway bars are not factored into the suspension frequency. The stiffer the springs the higher (faster) the suspension frequency. Street cars typically run around 1.3Hz and race cars typically come in around 2Hz. You would typically want a lower suspension frequency for a bumpier race track because large bumps require a lower suspension frequency to comply with the road surface.
Spring Angle Correction Factor compensates for the leverage applied to shocks that are not perpendicular to the lower arm (at static rest height).
Suspension Wheel Rate applies the spring rate to the leverage of the suspension motion ratio. The wheel rate is always lower than the spring rate.
Sway Bar Wheel Rate applies the sway bar rate to the leverage of the sway bar motion ratio. The sway bar wheel rate is always lower than the sway bar rate.
Bump Stop Wheel Rate applies the bump stop rate to the leverage of the suspension motion ratio. The bump stop wheel rate is always lower than the bump stop rate. The Suspension Tuning Spreadsheet assumes the bump stops are located on the shock shaft.
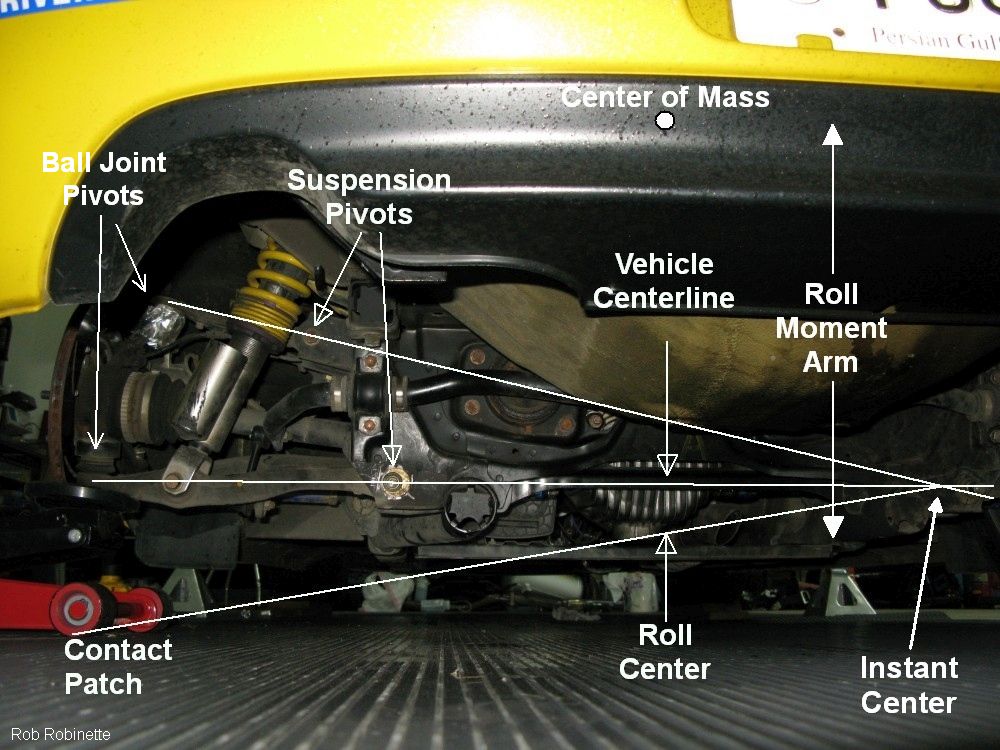
Suspension Motion Ratios

Suspension measurements used in the Suspension Tuning Spreadsheet.
The tire contact patch swings through an arc whose pivot point is the lower control arm's inner pivot. Since the shock and sway bar are mounted inboard, closer to the pivot point, they do not move as much as the contact patch when the lower control arm moves. The contact patch at the end of the suspension has a lever advantage over the shock spring and sway bar. This leverage reduces the spring rate and sway bar rate felt at the contact patch, which we call the wheel rate.
We calculate the spring motion ratio by dividing the distance from the inner pivot to the spring mount (d1 spring) by the distance from the inner pivot to the center of the tire contact patch (d2). Spring motion ratio = d1 Spring / d2. We then multiply the spring rate by the motion ratio to get the spring wheel rate. Note that anything that moves the contact patch in or out such as wheel offset, camber adjustments or adding wheel spacers will slightly affect the motion ratio.
Honda S2000 Rear Suspension
Note how the shock and spring are mounted to the lower control arm. See this for info on roll centers.
Similarly we calculate the sway bar motion ratio by dividing the distance from the inner pivot to the sway bar mount (d1 sway bar) by the distance from the inner pivot to the center of the tire contact patch (d2). Sway bar motion ratio = d1 sway bar / d2. We then multiply the sway bar rate by the motion ratio to get the sway bar wheel rate.
The Suspension Spreadsheet uses these simple formulas to calculate spring and sway bar wheel rates.
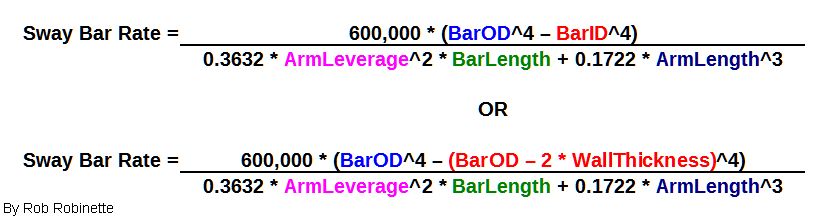
My Formula for Estimating Sway Bar Rate
How to Measure a Sway Bar
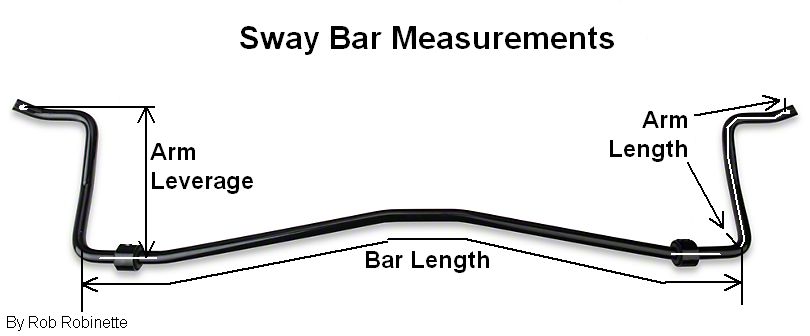
My sway bar formula uses Arm Leverage, Arm Length, Bar Length, Bar Outside (OD) and Inside (ID) Diameter (or Wall Thickness) in inches to estimate the sway bar rate.
The popular Puhn sway bar rate equation consistently underestimates actual, known sway bar rates so I came up with an equation that more accurately predicts real world sway bar rates.
Definitions of the sway bar measurements used by the equation:
Outside Diameter or OD: Use a caliper to precisely measure the diameter of the bar in inches. Measure on straight sections away from bends.
Inside Diameter or ID: Hopefully you can get this information from the bar manufacturer or someone has already cut the bar and measured the inside diameter. ID = OD - 2 * wall thickness. Inside Diameter for a solid bar = 0.
Bar Length: For a bar that has bends between the bushings the Bar Length should follow those bends since the extra bar can twist. The Bar Length should be measured from the first bend outside the bushing to the other side's first bend outside the bushing (center of bend to center of bend). Use a flexible tape measure to follow the bar bends.
Arm Length would then be measured from that same first bend outside the bushing to the bar hole following any bends (center of bend to center of hole). Use a flexible tape measure to follow the bar bends. If your bar has multiple end link holes measure all of them.
Arm Leverage is the distance from the bar pivot (at the bushing) to the arm hole (perpendicular to bar, center of bar to hole center). If your bar has multiple end link holes measure all of them.
My Suspension Tuning Spreadsheet does this calculation for you.
Other Automotive math calculations: automath.xls or automath.ods
Flyin' Miata Stage II Suspension Analysis
Analyzed by Suspension Spreadsheet on Google Docs
Set: Car Wt 2480, Driver 175, 8 Gallons fuel, Wt Dist 52/48
Suspension Frequency front 1.728Hz, rear 1.842 (Original Equipment (OE) 1.282Hz, 1.654Hz)
Ratio of Rear to Front Frequency 1.066 (OE 1.290)
I also replaced the stock bump stops with FatCatMotorsports 36/58 white (300in-lb front, 200in-lb rear).
Flyin' Miata Stage II Suspension
Front Roll Couple (FRC) % With Different Front & Rear Bar Settings
| Front \ Rear Sway Bar | Rear Stiff 525in-lb | Stiff & Mid 451in-lb | Mid 376in-lb | Mid & Soft 329in-lb | Rear Soft 282in-lb |
|
Front Stiff 622in-lb |
52.2% | 52.9% | 53.8% | 54.3% | 54.8%*(3) |
|
Stiff & Soft 560in-lb |
51.3% | 52.1% | 52.9% | 53.4% | 54.0% |
|
Front Soft 498in-lb |
50.4%*(1) | 51.2% | 52.0%*(2) | 52.6% | 53.1% |
*(1) Most Oversteer setting and closest to stock NC Miata of 46%.
*(2) FM Recommended setting.
*(3) Most Understeer setting.
Stock NC Miata FRC% is 46%. Table above does not consider bump stop stiffness. By Rob Robinette
Flyin' Miata Stage II Rear Suspension
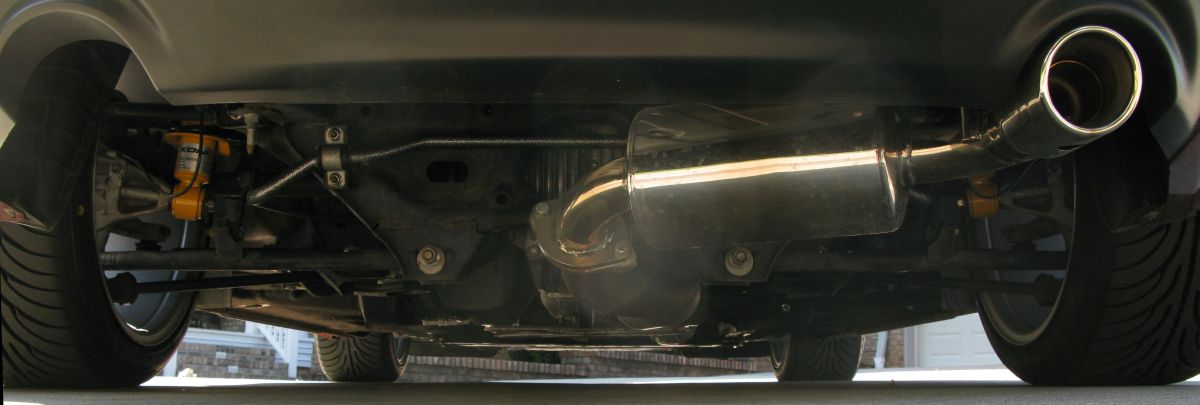
Yellow Koni Sport adjustable shocks are custom valved for the FM spring rates. FM rear adjustable sway bar is visible. Cat-back exhaust is Good-Win-Racing RoadsterSport Street Single. I love it.
Roll Stiffness and Front Roll Couple (FRC) with bump stops only comes into play near the end of shock travel. If your car has been lowered it is more likely the bump stop rates will come into play especially on bumpy roads/tracks.
Front FM bar set to Stiff, Rear set to Soft *(3) Most Understeer setting
Roll Stiffness 1219lb-ft/deg (OE 740)
Roll Stiffness + Bump Stops 1602lb-ft/deg (OE 961)
Front Roll Couple* (FRC) 54.8% (OE 46%)
FRC with FatCat Bump Stops 53.1% (OE bump stops 48%)
Front FM bar set to Stiff, Rear set to Mid & Soft
Roll Stiffness 1232lb-ft/deg
Roll Stiffness + Bump Stops 1614lb-ft/deg
Front Roll Couple* (FRC) 54.3% (OE 46%)
FRC with FatCat Bump Stops 52.7% (OE bump stops 48%)
Front FM bar set to Stiff, Rear set to Mid
Roll Stiffness 1244lb-ft/deg
Roll Stiffness + Bump Stops 1623lb-ft/deg
Front Roll Couple* (FRC) 53.8% (OE 46%)
FRC with FatCat Bump Stops 52.3% (OE bump stops 48%)
Front FM bar set to Stiff, Rear set to Mid & Stiff
Roll Stiffness 1263lb-ft/deg
Roll Stiffness + Bump Stops 1646lb-ft/deg
Front Roll Couple* (FRC) 52.9% (OE 46%)
FRC with FatCat Bump Stops 51.7% (OE bump stops 48%)
Front FM bar set to Stiff, Rear set to Stiff
Roll Stiffness 1282lb-ft/deg
Roll Stiffness + Bump Stops 1665lb-ft/deg
Front Roll Couple* (FRC) 52.2% (OE 46%)
FRC with FatCat Bump Stops 51.1% (OE bump stops 48%)
Front FM bar set to Soft, Rear set to Soft
Roll Stiffness 1174lb-ft/deg (OE 740)
Roll Stiffness + Bump Stops 1556lb-ft/deg (OE 961)
Front Roll Couple* (FRC) 53.1% (OE 46%)
FRC with FatCat Bump Stops 51.8% (OE bump stops 48%)
*Front FM bar set to Soft, Rear set to Mid *(2) FM recommended setting
Roll Stiffness 1199lb-ft/deg (OE 740)
Roll Stiffness + Bump Stops 1581lb-ft/deg (OE 961)
Front Roll Couple* (FRC) 52.0% (OE 46%)
FRC with FatCat Bump Stops 51.0% (OE 48%)
Notice how the FM recommended setting adds more understeer than the stock suspension
Front FM bar set to Soft, Rear set to Mid & Stiff
Roll Stiffness 1218lb-ft/deg (OE 740)
Roll Stiffness + Bump Stops 1600lb-ft/deg (OE 961)
Front Roll Couple* (FRC) 51.2% (OE 46%)
FRC with FatCat Bump Stops 50.4% (OE bump stops 48%)
Front FM bar set to Soft, Rear set to Stiff *(1) Most Oversteer setting & closest to stock
Roll Stiffness 1237lb-ft/deg (OE 740)
Roll Stiffness + Bump Stops 1619lb-ft/deg (OE 961)
Front Roll Couple* (FRC) 50.4% (OE 46%)
FRC with FatCat Bump Stops 49.8% (OE bump stops 48%)
*Front Roll Couple Percentage describes lateral load transfer distribution front to rear and subsequently the handling balance. It is the front roll stiffness divided by the total roll stiffness which is a ratio, front to rear, of the vehicle's total roll rate. Higher than 50% means the front wheels take more weight while cornering and the handling progresses toward understeer but for most cars around 55% gives balanced handling on the track while approximately 75% is best for autocross. For powerful cars a higher FRC% can help prevent power-on oversteer so a turbocharged Miata will typically need a higher FRC% than a normally aspirated Miata.
FM Stage II Sway Bars
Size and rates directly from Flyin' Miata
Front 1" 25.4mm Outside Diameter (OD), 0.688 Inside Diameter (ID), 0.156" 3.96mm wall
498 pound-inch soft, soft & stiff 560, 622 stiff
Rear 0.75" 19.05mm OD, 0.5" ID, 0.125" 3.05mm wall
282 lb-in soft, soft & mid 329, 376 mid, mid & stiff 451, 525 stiff
FM Stage II Springs
Front 300 lb/in, 5.4kg-f/mm, 52.6N/mm, ride height 13.5" (OE 165)
Rear 196 lb/in, 3.5kg-f/mm, 34.4N/mm, ride height 13" (OE 158)
FatCatMotorsports Bump Stops
Front 300
Rear 200
By Rob Robinette